
What a Zoning District's Name Is Actually Telling You
Have you ever compared two zoning districts by name and assumed the difference was cosmetic?
District names like R-40 and R-20 look like they could be arbitrary labels. They're not. The numbers usually reference minimum lot size in some form, and the practical difference they produce — how much density a given piece of land can support — can be significant even between districts that sit right next to each other.
Double the Density, Same City
Canton, Georgia's R-40 zoning district allows roughly 1.09 dwelling units per acre. R-20, a few blocks away, allows about 2.18 — exactly double. Same municipality, same basic single-family use, and a lot in R-20 can theoretically support twice the housing density of an equivalently sized lot in R-40.
This isn't a rounding difference. It's the kind of gap that changes whether a piece of land is worth evaluating for a small subdivision, an infill project, or simply understood as a larger single-family lot with no near-term subdivision potential.
Why the Gap Exists
Density differences like this one usually come from minimum lot area requirements written into each district. A district requiring a larger minimum lot area naturally supports fewer units per acre; a district with a smaller minimum supports more. R-40 and R-20 are, in effect, naming their own minimum lot area standards — and the density figure is simply what falls out of that math.
Once that connection is visible, the pattern becomes easier to anticipate elsewhere: a district name with a larger number in it is very often the lower-density option, and vice versa, though the specific figures always need to be confirmed rather than assumed.
Applying This to a Real Comparison
For anyone comparing two nearby properties in different residential districts, density is a fast way to understand which one carries more long-term potential without manually working through each district's minimum lot area and width requirements separately.
It's also a useful check before assuming that "similar-looking" areas of a city carry similar development potential. Canton's R-40 and R-20 districts can sit close enough together that the visual difference from the street is minimal, even though the allowed density is not.
Where IQLand Fits
A parcel's zoning district and its associated density figure are already assembled and searchable by address, which means this kind of comparison doesn't require pulling two separate code sections and calculating density from raw lot-area minimums by hand.
The Takeaway
A district's name often hints at its density ceiling, but the only reliable way to know is to check the actual figure — especially when comparing two areas of the same city that look similar but may not carry the same long-term development potential.
Want to compare the actual density allowed on two nearby properties? Search a parcel with IQLand →
IQLand
AI-powered land development intelligence platform
Related Posts
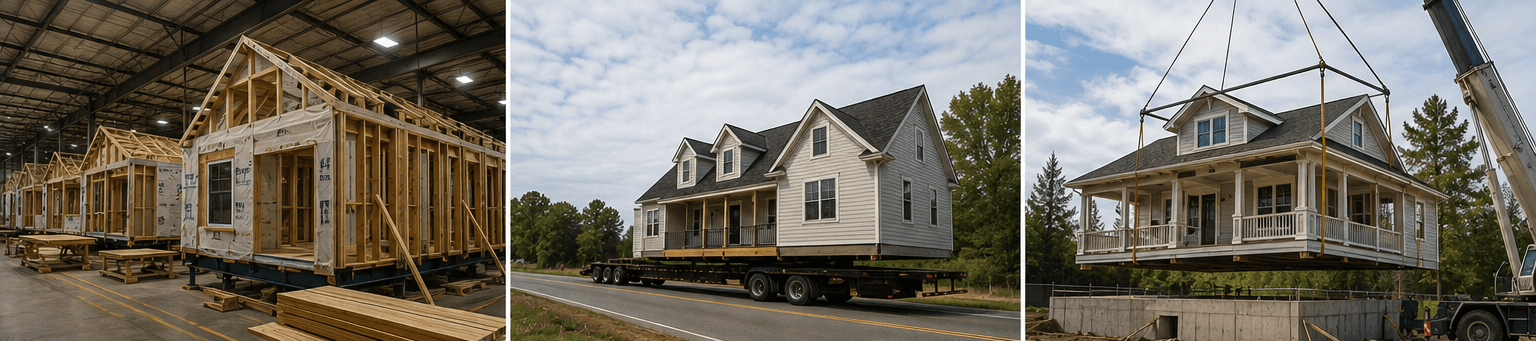
Prefab, Modular, or Manufactured? What's the Difference — and Who Cares?
Prefab, modular, and manufactured aren't interchangeable words. They're three regulatory categories with three different building codes, financing paths, and zoning treatments — and Congress just rewrote the rules for one of them.
The East Point District Where the Floor-Area Bar Nearly Doubles
East Point's R-3 district requires nearly double the floor area of R-1A on a comparably sized lot.
The Smaller East Point District With Its Own Floor-Area Math
East Point's R-1A district allows a smaller ground floor than R-1 next door — mixing the two up fails plan review.